3 minute read
MCP-Powered Error Tracking in Rails: Triage, Debugging and Profiling from Your Coding Agent
“Are there any recent errors in production?”
“Let’s triage the unresolved errors.”
“Ignore all Stripe errors.”
“Investigate error #13 and write a test that reproduces it.”
These are all prompts my coding agent understands when I work on projects that use Faultline.
A few months ago I wrote my own error tracking Rails engine. It all started when I felt the need to have better observability around errors and performance issues on a side project I was working on. I wanted something that had more or less the same capabilities as a tool like Sentry, i.e. getting notified whenever an error occurs in production and having enough context to investigate the root cause and provide a fix. But I also wanted something simple, Rails only, and integrated into any Rails application. Something that would be enough for my side projects, would give me the power to change it whenever I wanted, and would save me the hassle or the costs of installing a trial version of Sentry or other similar tools.
It has the basics of what you would expect from an error tracking engine. You can see graphs with the history of exceptions, you can dig into some exception details and see what the cause was, you can see the stack trace and inspect variables at raise point.
Notifications go out via Slack, Telegram, Discord, or email. No setup required on a Rails app. GitHub integration means one click opens an issue from any tracked exception. An APM module rounds it out: average time spent in ms, number of queries executed against the database, and flame graphs for the slowest parts of the codebase. All of which are table-stakes. Sentry has been doing it for decades.
What sets it apart is that this gem also includes an MCP server and Claude Code plugin. Now, if I want to triage bugs or check how the application is performing, I can just write to my coding agent instead of logging into the application, avoiding tedious copy-pasting and context-switching. Before this feature, I used to go into the application error dashboard and copy the stack traces and error messages into the coding agent.
To use it you need to generate a security token to authenticate requests to the MCP server, and install the Claude Code plugin. The plugin has skills that allow you to list errors, get more information regarding a specific exception, or perform destructive actions on the server, like updating, resolving, changing statuses, or even creating GitHub issues. Check the README for a full list of capabilities.
The tool for debugging a specific exception is useful because it pulls the full exception and stack trace from the server. And since I’m already inside the project directory, the coding agent can immediately relate the stack trace to the current codebase and propose a fix.
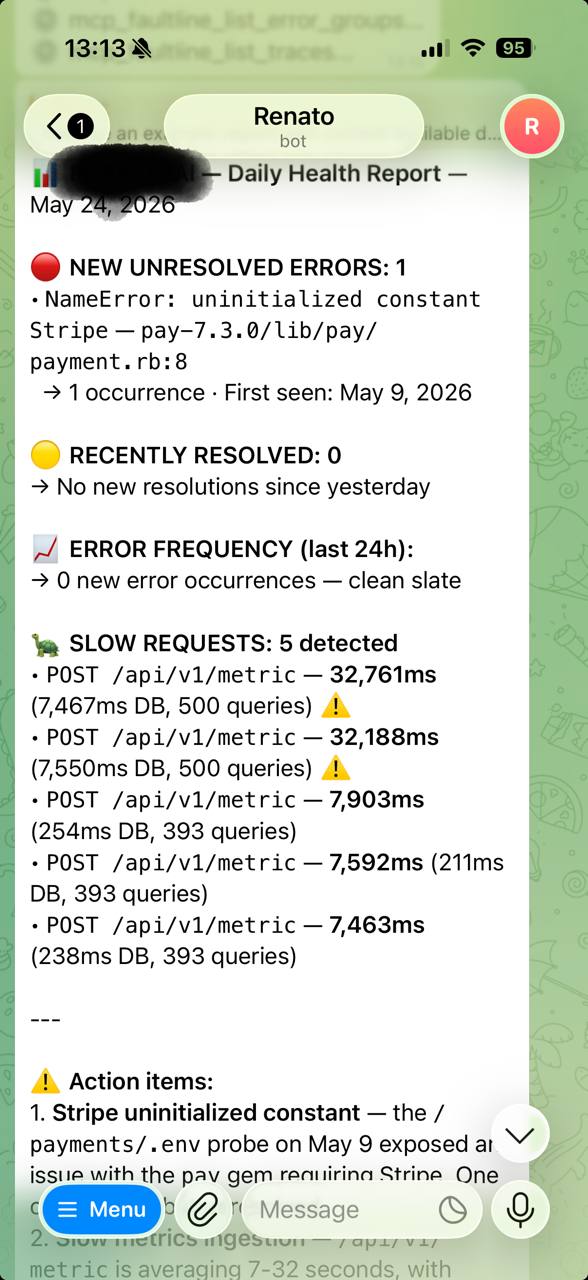
Using the MCP server from the coding agent is great, but you don’t need to limit yourself to just this use case. I’ve provided the MCP URL and authentication token to my Hermes agent and asked it to provide me with daily reports regarding my production bugs and application performance. The next logical step is to have it open PR drafts with solutions for any new issues that arise.
If you try it out, open an issue or let me know how it goes. So far I’ve only run it on my own side projects, so I’m curious to see how the debug flow performs on something bigger.